01
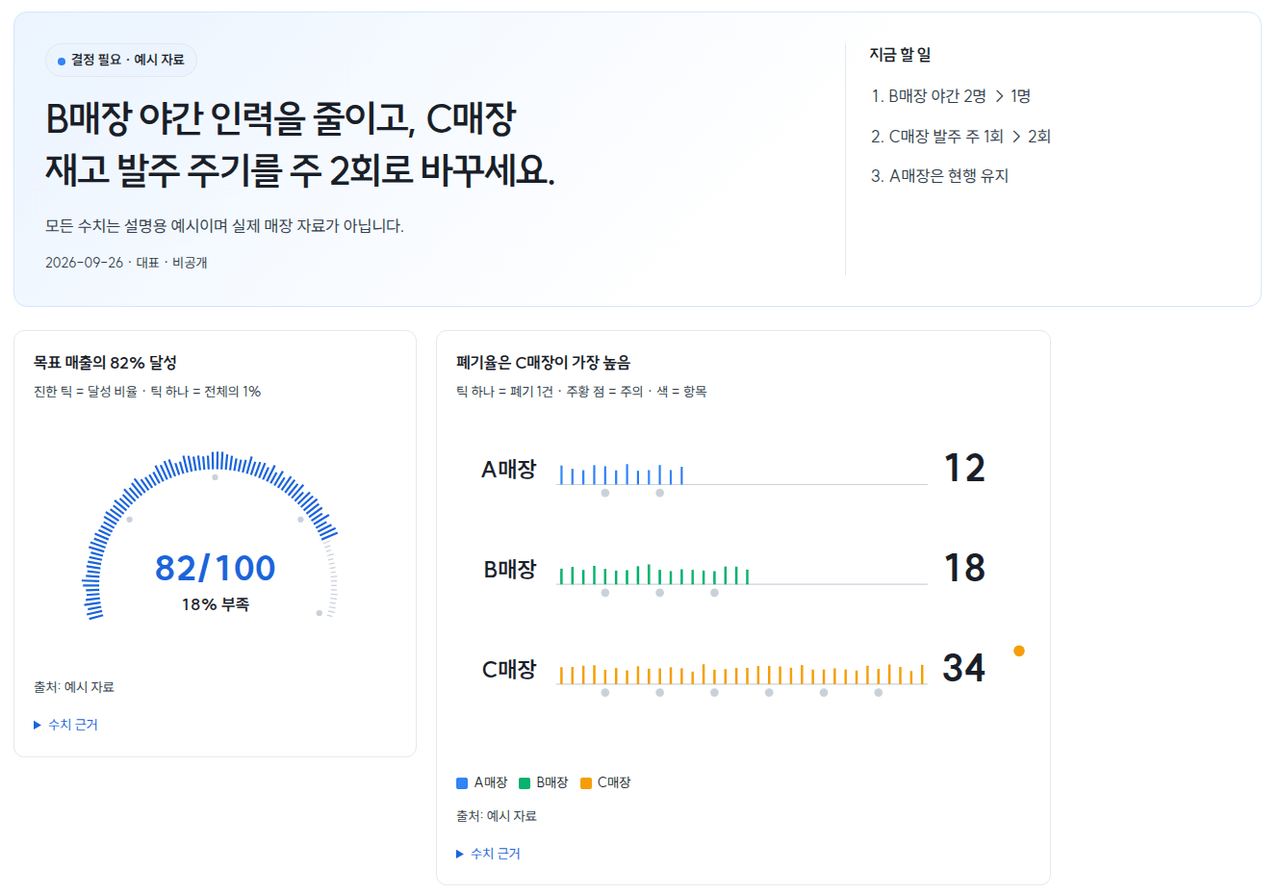
1. The point and numbers first
One line, three actions, then one chart per conclusion.
- Chart titles state the conclusion
- Chart chosen by data shape
 haeminway
 CASE 03 · Decision report
More numbers make longer reports nobody reads. This reads conclusion → key numbers → where it breaks → what to do now, on a phone.
BEFORE → AFTER
Tables in PDFs, screenshots in chat, dozens of slides — meetings end with 'let's revisit'.
Steps to a decision
HOW IT RUNS
A real render of an example report; all numbers are examples.
01
One line, three actions, then one chart per conclusion.
02
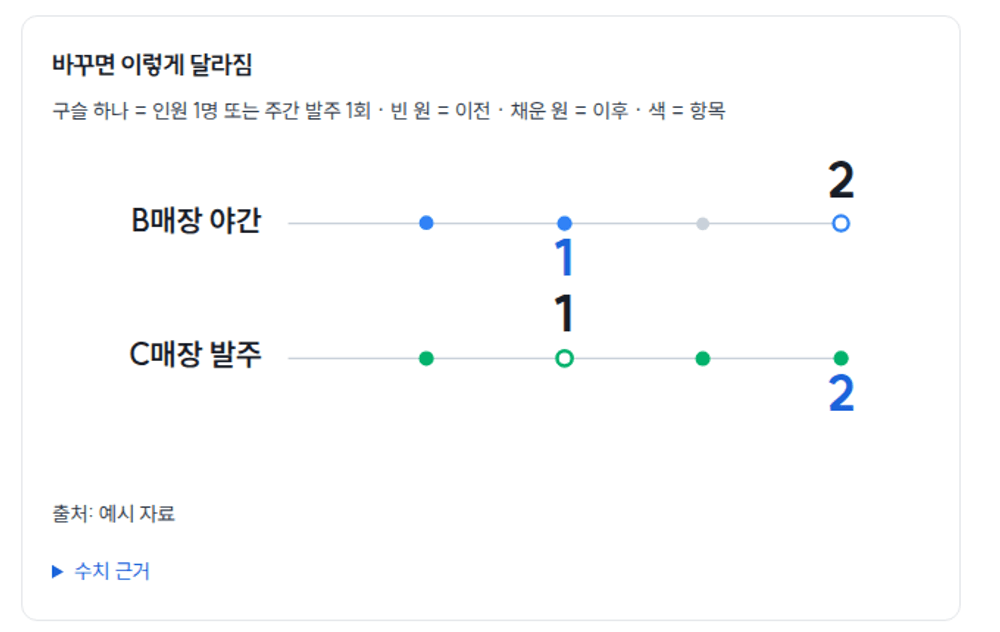
Before/after per action answers 'so what?'.
03
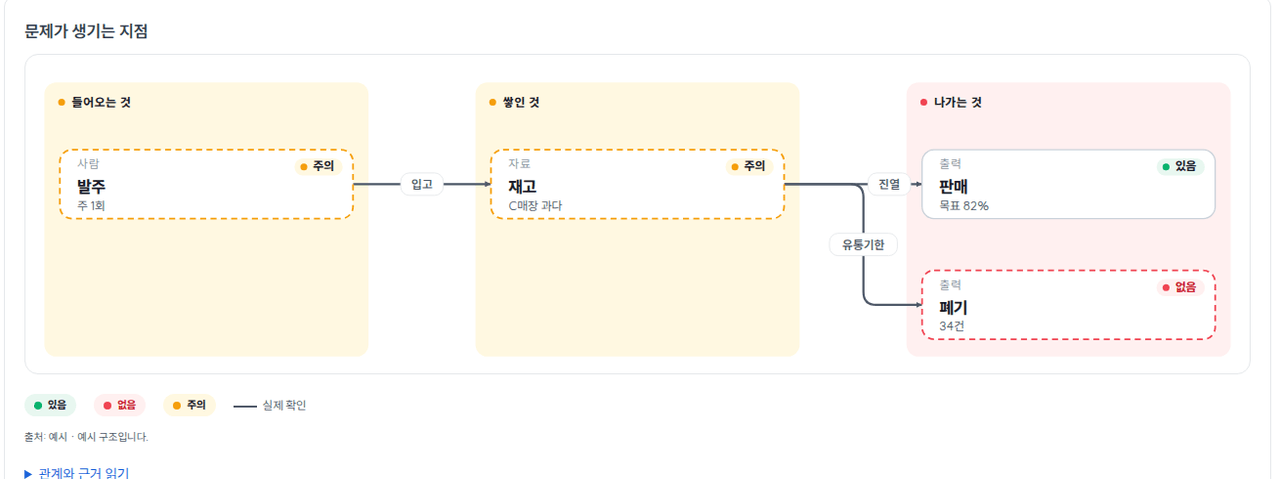
Inflow → stock → outflow, with the stuck point marked.
RULES
DETAIL
Anywhere the reader needs 'so what do I do?'.
| Operations | branch comparisons and actions |
|---|---|
| Monthly | month-over-month and next steps |
| Incidents | what happened, what was fixed |
| Decisions | options and a recommendation |
Google Sheets automation
Show me your current forms and sheets; I'll map where people carry data.